Shiba Inu (SHIB) has seen a notable rally, climbing for four straight days to hit $0.0000020, its peak value since June 17. This upward trend mirrors Bitcoin’s rise to $65,000, its highest level since June 19, and coincides with the crypto fear and greed index approaching the greed zone at 60.
The token has seen a remarkable increase in trading activity, with daily trading volume surging by 136.80% to approximately $788.37 million. Open interest also climbed by 4.75%, reaching $37.92 million. These metrics indicate growing confidence and engagement in Shiba Inu derivative contracts, reflecting a positive market sentiment.

The spot netflow for SHIB registered at -1.87, suggesting that more tokens are withdrawn from exchanges than deposited. This trend indicates that investors are moving their SHIB to private wallets, likely anticipating further price appreciation.
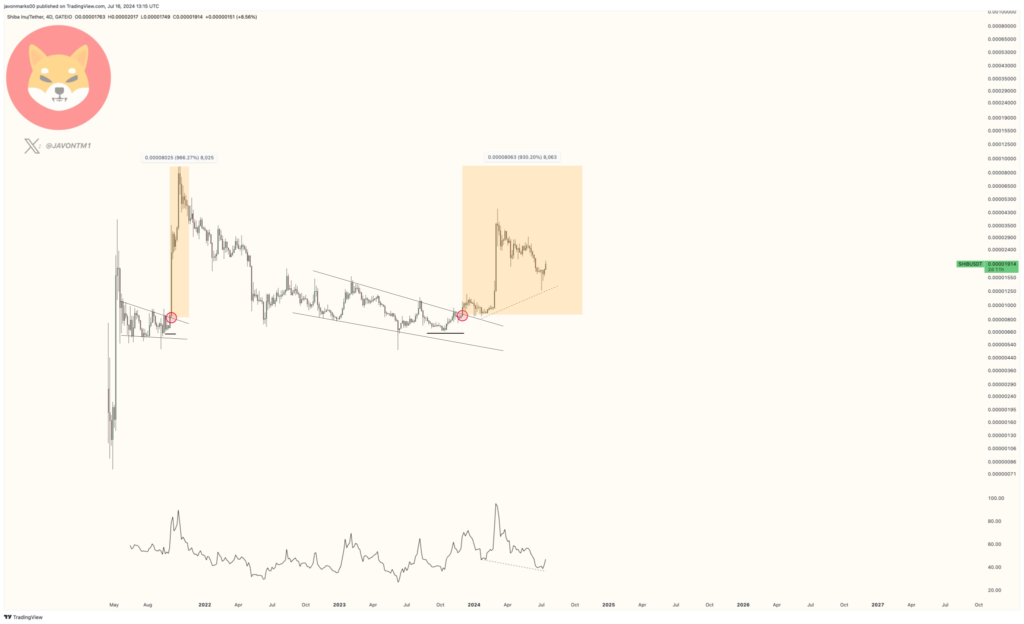
In a recent analysis, expert crypto analyst Javon highlighted the significant bullish potential for SHIB. His technical analysis suggests that the token is on the verge of a substantial breakout reminiscent of previous bull runs. Javon noted a breakout from a falling wedge pattern, a bullish formation often preceding significant price surges.

SHIB Breakout Targets ATH
Javon parallels the current breakout and a similar pattern that led to a 400% increase in its price from $0.000009079 to $0.00004559. He emphasizes that SHIB is maintaining its breakout above the resistance level, indicating a potential 351% increase, targeting the all-time high of $0.0000886.
This projection is supported by a recently confirmed hidden bullish divergence between the price and the Relative Strength Index (RSI). This divergence signals underlying strength and continues upward momentum, suggesting that it may soon see significant price increases.
Furthermore, the MACD crossover, and positive histogram indicate that the token is in a bullish phase. However, the Stochastic RSI is currently at extremely high levels, hovering around the 100 mark. This overbought territory signals strong buying pressure but raises the risk of a potential pullback or correction in the near term.
Interestingly, SHIB has just surpassed its 200-day Exponential Moving Average (EMA), which signifies a bullish shift or positive momentum, indicating current prices exceed the long-term average. Further upward movement hinges on closing above the intraday high of $0.000020. Failure could result in a doji or shooting star candlestick pattern, resuming the downtrend.
Related Readings | Ethereum Jumps 5% To $3,300 As SEC’s Imminent Spot ETF Decision Sparks Explosive Bull Run


