The meme coin sector has seen a significant resurgence in the past 24 hours, led by Bonk Inu (BONK). It surged by over 10.58%, trading at $0.00002644. This price jump pushed its market capitalization to $1.81 billion, placing it 46th in the cryptocurrency market. Analysts are optimistic, predicting further price increases in the coming days.
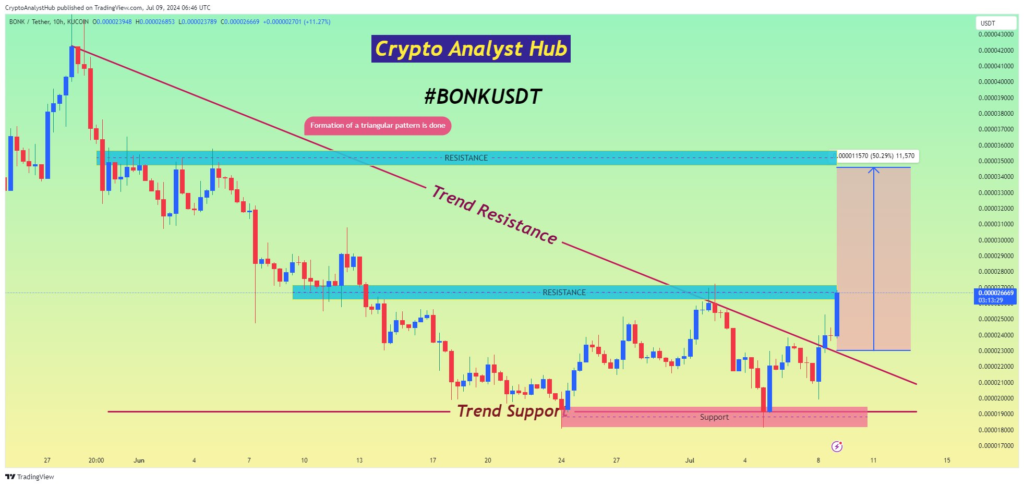
CryptoAnalystHub’s recent technical analysis of the BONK/USDT trading pair reveals a bullish triangular pattern, a technical indicator often preceding significant price movements. The analyst notes that a breakout from this pattern has already occurred, suggesting an upward trend for its price.

BONK Breaks Resistance, Eyes 50% Surge
The breakout past the trend resistance level around 0.000026669 USDT indicates a potential rise of up to 50%, reaching approximately 0.000035000 USDT. It follows a period where the price found solid support around 0.000019000 USDT. The breach of the triangular pattern’s resistance line highlights a bullish sentiment, setting the stage for a significant upward trajectory.
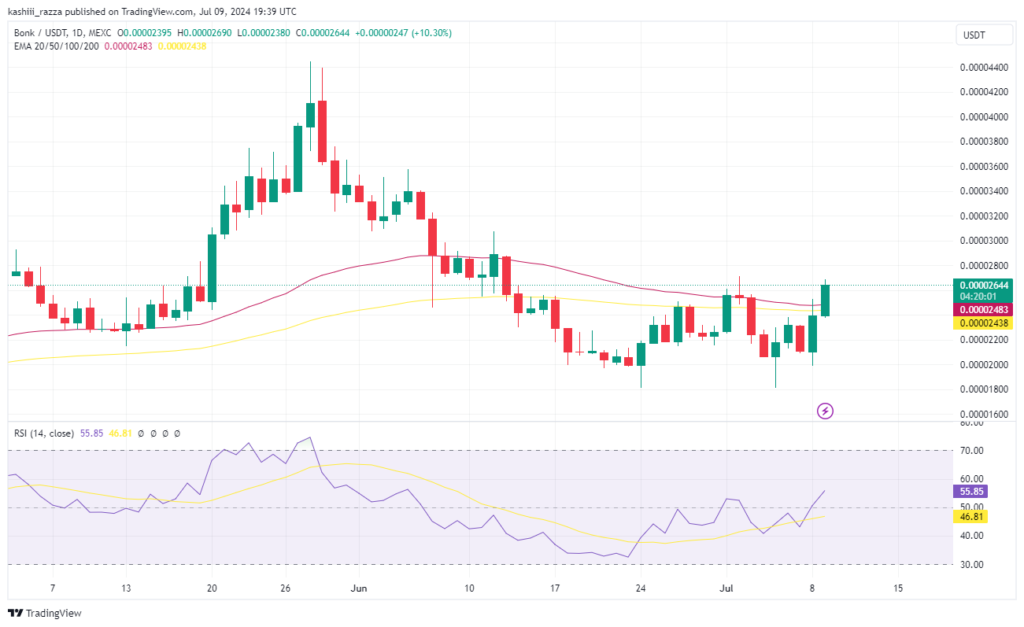
Currently, the BONK price is above both the 50-day Exponential Moving Average (EMA) and the 100-day EMA, indicating a short-term bullish trend. The 50 EMA remains above the 100 EMA, reinforcing the bullish sentiment and indicating sustained upward momentum over a more extended period.

The Relative Strength Index (RSI) is approximately 55.85, placing it in the neutral zone, suggesting neither overbought nor oversold conditions. This balanced market sentiment indicates potential for further upward movement if buying pressure increases.
The bullish outlook is confirmed by the MACD indicator, showing the MACD line above the signal line, indicating positive momentum. The histogram in green further supports this bullish divergence. Additionally, the Chaikin Money Flow (CMF) is at 0.02, suggesting a net inflow into BONK, adding to the buying pressure.

Overall, the technical indicators for BONK on the daily timeframe suggest a potential upward trend continuation. The price above the critical moving averages and positive readings from RSI, MACD, and CMF all contribute to a cautiously optimistic outlook for the cryptocurrency.
Related Readings | BNB Breaks Support At $495; Eyes $650 Amidst 4.66% Price Drop


